What I Learned about the Strengths and Challenges of the LRSD as Superintendent for a Year
October 23, 2016
Baker Kurrus
Served as LRSD Superintendent, 2015-2016
Do we want a unitary PUBLIC system?
Should charter schools enroll student with disabilities, students who are poor,
and students who are learning English?
| 2015-2016 | Limited English Proficiency | SPED | F&R Lunch |
|---|---|---|---|
| LRSD | 12.3% | 11.73% | 80.9% |
| eSTEM | 1.5% | 7.39% | 32.6% |
| LISA | 3.3% | 6.56% | 43.4% |
LISA and eSTEM elementaries would be the fourth and fifth most affluent elementary schools in LRSD. Based on 2014 data, LISA ranked 9th among LRSD schools in literacy and math. eSTEM was 7th in literacy, and 4th in math.
- About half of LRSD Special Ed. students spend 80% of their school day in a regular classroom
- About 18% of LRSD Special Ed. students are not able to spend much time in a regular classroom (less than 40% of the day)
- 93% of eSTEM’s Special Ed. students spend 80% of their school day in a regular classroom
Former LRSD Students Enrolled by LISA and eSTEM, 2009-2015
- Total number: 1,856
- Of the 1,856 only 13 were English language learners. In 2016 LRSD had 2,855 ELL students. LISA and eSTEM did not take any of these from LRSD in 2016. Their combined enrollment of ELL is between 0% an 1%.
- 57% of LRSD transfers to LISA and eSTEM did not qualify for a reduced price lunch. Overall 29.2% of LRSD students do not qualify.
- The real difference is in the number of students in abject poverty.
- From FY 2009 through FY 2016, 81.9% of the LRSD students who transferred to LISA and eSTEM were proficient and advanced in literacy.
- 77.2% were proficient and advanced in math.
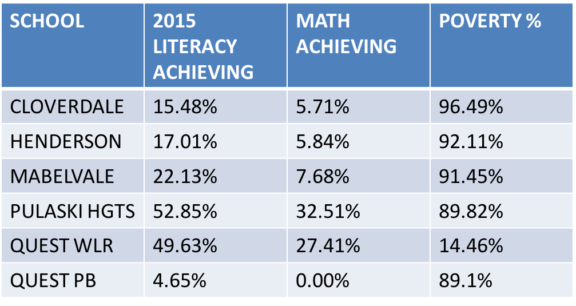
2015 PARCC Assessment and Poverty %
Waivers: Complete Red Herring
- If waivers are good for students, why doesn’t the state board just make them available to everyone automatically?
- What policy makers are impacting LRSD and the educational environment in Little Rock?
- What policies are being supported, and what are the consequences?
- Are schools leading indicators or trailing indicators of the health of a community?
2015 PARCC Achievement Results: ELA Grade 03, Statewide Results
| % met or exceeded expectations | |
|---|---|
| Not Free/Reduced Lunch (11,645) | 46.5% |
| Free/Reduced Lunch (23,226) | 20.4% |
What does this tell us?
Is it fair to rank schools by the performance of their students?

